IELTS Writing Task 1
-
Copy link


Try AI Essay Checker for Instant Band Score
“Explore this comprehensive guide on IELTS Writing Task 1 and learn how to improve your writing skills and avoid common mistakes to achieve that band score! “
Interpreting visual data and summarizing information accurately is a vital skill for higher education and global communication and this skill is evaluated in IELTS Writing Task 1 exam. It is, thereby, a crucial component of both the Academic and General Training modules.
In this comprehensive guide, we will examine all aspects of IELTS Writing Task 1, exploring its different formats, question types with IELTS exam examples, tips for success, and common mistakes to avoid.
Understanding IELTS Writing Task 1
Task 1 of IELTS Writing assesses the candidate's ability to interpret and present information in a clear and coherent manner. It requires candidates to describe visual information or frame a letter in a minimum of 150 words in 20 minutes. The key skills tested in Task 1 include:
- Understanding Visual Data or Prompts: Candidates must accurately interpret the visual data provided or prompts for letters and convey the main trends, comparisons, and significant points accurately.
- Organizational Skills: Structuring the response effectively is essential, including introducing the topic, providing an overview or a purpose, and presenting key details logically.
- Language Accuracy: Candidates are evaluated on their ability to use a range of vocabulary, grammatical structures, and cohesive devices to express ideas precisely.
Are you having difficulty dealing with IELTS writing questions? Book a FREE Demo!
IELTS Writing Task 1 Question Types
You have to keep in mind that Task 1 differs for both IELTS General and Academic purposes. So, the different types of questions in these two types of IELTS exam are given below.
IELTS Academic Writing Task 1
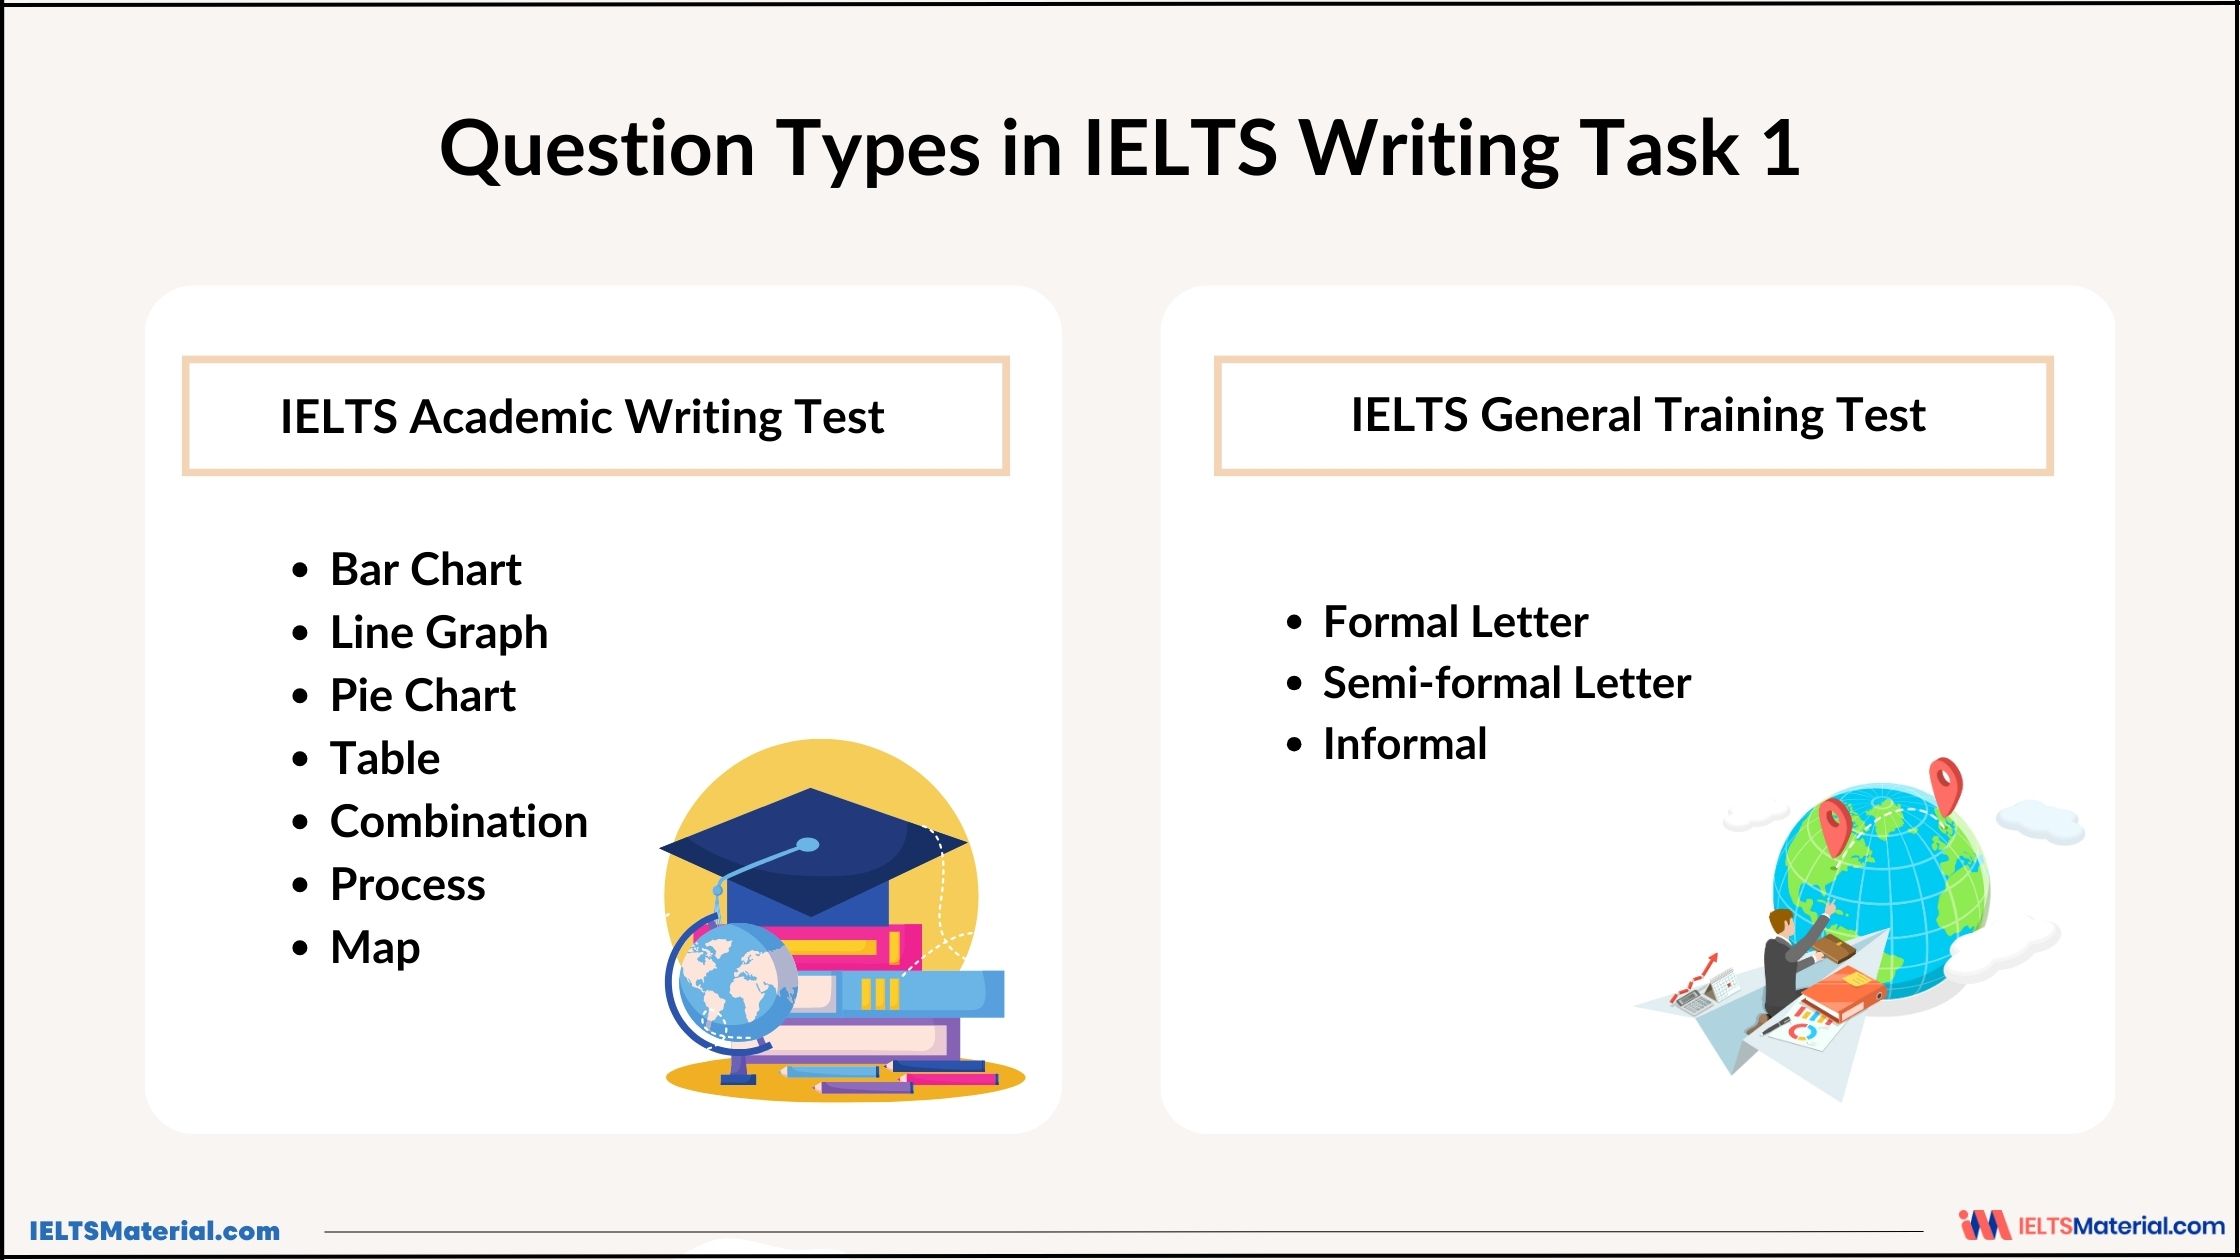
You will be required to represent data relevant to an academic context that are shown in one or more figures, such as graphs, charts, tables, diagrams, or processes in Task 1 of IELTS Academic. There are typically seven types of questions in IELTS Writing Task 1 Academic:
- IELTS Table chart
- IELTS Bar chart
- IELTS Line graph
- IELTS Pie chart
- IELTS Map Diagram
- IELTS Process diagram
- Combination (Mixed) charts
For a deeper comprehension of the subjects, it is crucial to regularly practice using the IELTS writing task 1 practice tests with answers.
Get set to take a look at the IELTS Academic Writing Task 1 question types with band 9 sample answers now!
Table Chart Sample
|
The graph below shows the oil production (in barrels) in several African countries from 2000 to 2004. Summarise the information by selecting and reporting the main features, and make comparisons where relevant. Write at least 150 words. |

Sample Answer
The table compares the oil production in four different African countries, Nigeria, Chad, Congo Brazzaville, and Cote d’Ivoire from 2000 to 2004.
Overall, it can be seen that Nigeria registered the highest oil production in all the years. Also, while the oil production in Chad and Cote d’Ivoire increased, it fell in Congo Brazzaville and fluctuated in Nigeria.
There was no oil production in Chad from 2000 to 2002. In 2003, Chad produced about 50,000 barrels, and this increased and reached 290,000 barrels in 2004. Similarly, Cote d’Ivoire’s production also increased from 8000 barrels in 2000 to 45,000 barrels by 2004. On the other hand, the production of oil in Congo Brazzaville decreased continuously. In 2000, 280,000 barrels of oil were produced in Congo and its production fell by 10,000-20,000 barrels year by year and reached 205,000 barrels in 2004.
Finally, oil production in Nigeria varied. In 2000, 2,000,000 barrels were produced and this increased slightly to 2,100,000 by 2001. However, in the next year, production fell by 200,000 barrels. From 2002 onwards production increased continuously and in 2004, a production of 2,200,000 barrels was recorded.
Bar Chart Sample
|
The chart below shows the spending (in millions) by 18-20 year olds in one country on five different products in 2010 and 2014. Summarise the information by selecting and reporting the main features, and make comparisons where relevant. Write at least 150 words. |

Sample Answer
The bar graph compares the spending of 18-20-year-olds on food, clothes, books, smartphones, and toiletries in 2010 and 2014 in a particular country.
Overall, it can be seen that the spending on all the products except books and clothes rose with time. Furthermore, the maximum spending was done on food in both years.
In 2010, the 18-20-year-olds spent roughly 3700$ million on food, which was followed by clothes at about 2500$ million dollars. Smartphones and toiletries accounted for about 2000$ million in spending each. The least expenditure was done on books, with a figure of only $1000 million.
In the next four years, the expenditure on food, smartphones, and toiletries increased and in 2010, about $4300 million was spent on food, whereas about $2700 million was spent on smartphones. The amount spent on toiletries rose minimally by about $100 million. By contrast, the spending on books became nearly half. Lastly, the expense of clothes remained unchanged at $2500.
Pie Chart Sample
|
The pie chart below shows how electricity is used in an average English home. Summarise the information by selecting and reporting the main features, and make comparisons where relevant. Write at least 150 words. |

Sample Answer
The pie chart depicts the average electricity usage in a typical English household. The highest proportion of energy consumption, amounting to 52.5%, is attributed to heating rooms and water.
Overall, the chart shows the electricity consumption in a typical English home. Most energy is devoted to heating, followed by kitchen appliances, while the remaining portion is divided between essential and less frequently used household items.
This significant allocation can be attributed to the unpredictable weather patterns in the UK, where temperatures rarely exceed 20 degrees Celsius during the summer compared to other European countries experiencing temperatures above 25 degrees Celsius. Consequently, households in these countries utilize less electricity during the summer months. Kitchen appliances, including ovens, kettles, and washing machines, account for the second largest portion of British electricity usage, representing 17.5% of total household energy.
The remaining 30% of electricity is divided equally. Half of this share is utilized by essential appliances like house lighting, televisions for entertainment, and radios for music, which are integral components of our daily lives. The other half of the 30% is consumed by appliances such as vacuum cleaners, food mixers, and electric tools, which are typically used weekly.
Line Graph Sample
|
The graph below gives information about changes in the birth and death rates in New Zealand between 1901 and 2101. Summarise the information by selecting and reporting the main features, and make comparisons where relevant. Write at least 150 words. |

Sample Answer
The graph shows changes in the birth and death rates in New Zealand since 1901, and forecasts trends until 2101.
Overall, these opposing trends mean that the death rate will probably overtake the birth rate in around 2041 and the large gap between the two levels will be reversed in the later part of this century.
Between 1901 and the present day, the birth rate has been consistently higher than the death rate. It stood at 20,000 at the start of this period and increased to a peak of 66,000 in 1961. Since then the rate has fluctuated between 65 and 50 thousand and it is expected to decline slowly to around 45,000 births by the end of the century.
In contrast, the death rate started below 10,000 and has increased steadily until the present time. This increase is expected to be more rapid between 2021 and 2051 when the rate will probably level off at around 60,000, before dropping slightly in 2101.
Process Diagram Sample
|
The diagram below shows the process by which bricks are manufactured for the building industry. Summarise the information by selecting and reporting the main features, and make comparisons where relevant. Write at least 150 words. |

Sample Answer
The given diagram shows different stages of brick manufacturing for the building industries.
Generally speaking, overall the brick production involves 7 steps, starting from the digging stages and ending at the delivery stage.
As is given in the graph, the first step of brick manufacturing is digging the clay with a large digger. This clay is then filtered and processed in a roller machine and then mixed with sand and water. In the third stage, the mixture is either kept in a mold or cut in a wire cutter to make the raw shape of the bricks. In the next step, the shaped raw bricks are dried for 24 to 48 hours in a drying oven.
After that, the dried raw bricks are kept in a kiln, both at moderate and high temperatures, up to 1300 degree centigrade, and then placed in a cooling chamber for about 48 to 72 hours. This process makes the brick to be packed and delivered in the final two steps. The delivery process is the final process of brick manufacturing and as it is noted, brick-making is a moderately complex process that requires some predefined work to make it usable.
Map Diagram Labelling Sample
|
The maps illustrate an industrial area in Norbiton in the present day compared with plans for future development of the site. Summarize the information by selecting and reporting the main features, and make comparisons where relevant. Write at least 150 words. |

Sample Answer
The maps illustrate an industrial zone in Norbiton town currently and a proposed redevelopment scheme for the whole area.
Overall, Norbiton will become more residential, so the factories will be demolished to make way for new housing. Moreover, two new roads and a mini roundabout will be built along with new shops, a medical center, and a school.
Looking at the current layout, a main road runs from east to west with a roundabout in the middle, which is surrounded by factories that extend to the east. In the north, farmland is situated over the river. There are currently no houses or other facilities in this industrial zone.
Regarding redevelopment, from the central roundabout a new road will extend north and a bridge is to be constructed over the river with plans for new housing on the farmland. In addition, a road extending northwest with housing and shops is earmarked for construction. Next to the new mini roundabout, a medical center will be built. To the east, a school and playground are proposed with extra residential facilities. Notably, no factories are expected to remain in the plans.
Combination Charts Sample
|
The graph below shows CO2 emissions for different forms of transport in the European Union. The Pie Chart shows the percentage of European Union funds being spent on different forms of transport. Summarize the information by selecting and reporting the main features, and make comparisons where relevant. Write at least 150 words. |

Sample Answer
The bar chart outlines how many Japanese travelled overseas between 1985 and 1995 while the line graph delineates the percentages of these tourists who visited Australia in particular between 1985 and 1994.
Overall, the number of Japanese who made overseas travels soared and this is also true for the Australian visiting travelers from Japan.
As can be seen from the illustration, around 5 million Japanese citizens travelled to different countries in 1985 which kept on increasing each year except in 1991. From approximately 7 million tourists in 1987, it went as high as 12 million in just 6 years. Finally, in 1995, around 15 million Japanese toured foreign countries which was three times higher than that of a decade earlier.
The line graph shows that 2% of Japanese tourists reached Australia in 1985 and with a steady increase this figure went as high as roughly 5% in 1988. The next year the ratio slightly dipped but went higher each year in the subsequent years. Australia received more than 6% of Japanese travellers in 1993, the highest, which stood at exactly 6% in 1994.
Ready to boost your IELTS Writing skills? Enroll in our IELTS Online Classes!
IELTS General Writing Task 1
The candidate must compose a letter outlining details from IELTS GT Writing Task 1 or provide an explanation of a circumstance. There are three types of letters for IELTS General writing task 1:
- IELTS General Writing Task 1: Sample Formal Letters
- IELTS General Writing Task 1: Sample Semi-Formal Letters
- IELTS General Writing Task 1: Informal Letters
Candidates are assessed on their ability to engage in personal contact, elicit and offer general factual information, express needs, likes, and dislikes, as well as their opinions, in the IELTS general writing task 1.
Get set to take a look at the IELTS General Writing Task 1 question types with band 9 sample answers now!
Formal Letter Sample
|
You have eaten at a restaurant and it was such a terrible experience that you have decided to inform the manager by letter of what happened and that you want your money back. Things to include:
|
Sample Answer
Dear Sir,
I would like to express my regret for having dined at your establishment last night; please allow me to explain. The table was booked two months in advance since it was to cater for a major professional event, and yet we were informed by the maitre d’ upon arrival that there were no tables sufficiently large and we would have to dine separately. I did press this point with your staff as my party needed to remain in each other’s company, but we were told that it was simply impossible to seat us all together.
In addition to this, several menu items were unavailable on the night, including every vegetarian option, meaning that three members of my party were left to eat only bread throughout the meal. As a result of these incidents, I had intended not to pay, but your staff informed us that they would call the police if we refused, and so to avoid further embarrassment, I complied.
This experience was entirely unacceptable, and I would like to request a full refund of the amount paid. I would also suggest that your staff not promise customers the degrees of service that they are unable to provide in order to avoid disappointing experiences such as these ones.
Regards,
Paul Hollywood
Semi-formal Letter Sample
|
You moved to a new country and you want to write a letter to your former colleague. In your letter, you should:
|
Sample Answer
Dear Rohan,
It has been a while since I spoke to you. I’m writing this letter to inform you that I’ve moved to Brussels to pursue my career as a Senior Consultant in Java at ABC Company. It is one of the prestigious companies here, and I consider myself lucky to have been selected here.
Life is great in Brussels. It has a tremendous maritime temperate climate with summers being warm and winters being cool. Due to its proximity to the Atlantic ocean, it has an almost pleasant weather throughout the year. There is not much snowfall, though. Nearly 70% of the population in Brussels have foreign origins. If circumstances are favorable, I’m planning to stay here at least for the next ten years.
I know you have a strong background in Java, and Brussels has plenty of opportunities for it. I can arrange for an interview at ABC company itself. Please do send me your Resume. Even otherwise, feel free to come here for a holiday. Brussels is such an artistic place.
Looking forward to hearing from you.
Yours truly,
Samuel
Informal Letter Sample
|
A foreign friend of yours plans to visit your place and stay with you, but you are not available on that date. Give your friend another alternate date for the visit. In your letter, you should:
|
Sample Answer
Dear Reeta,
I got your message that stated your visit to my city. Let me tell you, I am more than excited and elated to receive you. However, I’d like to apologize beforehand for what I am going to say next. The date that you mentioned – 25th February, unfortunately, I am not available on this date.
I have my last exam; thus, I would have to go out of the city for the entire day. If it was not that important, I wouldn’t be asking you not to come. In fact, for months, I was waiting eagerly to meet you.
Why don’t you change the date if possible? I am free anytime after 25th February. You will be more than welcome to stay with me for as many days as you want. We are definitely going to have a fun-filled time together. Once again, I am sorry for this inconvenience. Looking forward to meeting you soon.
Yours lovingly,
Sheela
Some More IELTS General Writing Task 1 Samples
Here are some latest Writing Task 1 topics with sample answers for IELTS General Training:
Formal Letter
Semi Formal Letter
Informal Letter
Evaluation Criteria for IELTS Writing Task 1
The purpose of the IELTS Writing Task 1 question is to assess a candidate's writing abilities.
- Four criteria are used to assess a candidate's IELTS score: Task Achievement, Coherence & Cohesion in IELTS Writing, IELTS Lexical Resource and IELTS Grammatical Range & Accuracy.
- For IELTS Writing Task 1, each component is worth 25% of the candidate's final score.
Therefore, these are standardized measures that a student needs to follow throughout their answer to achieve their desired IELTS band score. Check the table given below:
| Band Score | Task Achievement | Coherence & Cohesion | Lexical Resource | Grammatical Range & Accuracy |
| 9 |
|
|
|
|
| 8 |
|
|
|
|
| 7 |
|
|
|
|
| 6 |
|
|
|
|
| 5 |
|
|
|
|
Top Tips for Success in IELTS Writing Task 1
Candidates must follow some IELTS preparation tips in order to master IELTS Academic writing task 1 and IELTS GT writing task 1. So, given below are some top tips to structure your answers for IELTS Writing Task 1.
- Understand the Task Requirements: Read the instructions carefully and identify the main features and key trends in the visual data.
- Plan Your Response: Spend a few minutes organizing your ideas before you start writing. This will help you structure your response effectively.
- Use a Variety of Vocabulary: Demonstrate your lexical range by avoiding repetition and employing synonyms to describe the data accurately.
- Focus on Significant Details: Highlight the most important information and avoid including unnecessary details that do not contribute to the overall understanding of the required details.
- Practice Time Management: Allocate enough time to each task and aim to complete Writing Task 1 within the recommended 20 minutes.
- Use Synonyms - Don't just copy words from the prompt. Paraphrase with your own vocabulary.
- Include Units of Measurement - Use measurement units like millions, percentage, tons, dollars. This shows attention to detail and highlights obvious contrasts or similarities between data trends to make logical comparisons.
- Use Linking Words - IELTS Writing Task 1 Connectors add like "while", "in addition", "on the other hand" connect your ideas and show cohesion.
- Stick to Plain English - Don't try to sound overly complex. Keep your language clear and concise.
Common Mistakes to Avoid in IELTS Writing Task 1
While analyzing visuals or framing the letter might seem straightforward, Task 1 can trip you up if you're not careful. Here are some key mistakes to avoid:
- Misinterpreting Data/Prompts: Ensure that you accurately understand the information presented in the visual data before attempting to describe it.
- Ignoring Task Instructions: Pay attention to the specific requirements of each task and avoid straying from the given topic.
- Overlooking Grammar and Spelling: Proofread your response carefully to eliminate grammatical errors and spelling mistakes.
- Lack of Coherence and Cohesion: Ensure that your response is well-structured and cohesive, with clear connections between sentences and paragraphs.
The IELTS Writing Task 1 test may seem challenging, but with dedication and the right strategies, you can conquer it. Remember, consistent practice, a focus on improvement, and a clear understanding of the format are key to achieving your desired band score. If you need any sort of guidance, feel free to interact with our IELTS experts or be a part of IELTS webinars. So, take a deep breath, pick up your pen, and embark on your journey to IELTS writing mastery!
Some More IELTS Academic Writing Task 1 Samples
Check out the recent Writing Task 1 topics with IELTS Writing Task 1 sample answers to practice:
- Village of Stokeford in 1930 and 2010- Map
- Paradise Island Map – IELTS Academic Writing Task 1 Answers
- IELTS Academic Writing Task 1 Example 4 : Development of the village of Rye mouth – Map
- IELTS Academic Writing Task 1 Topic: The development of cutting tools in the stone age – Diagram
- IELTS Academic Writing Task 1 Example 3: Civic Centre – Map
- Changes in Modes of Travel in England Between 1985 and 2000- IELTS Writing Task 1 (Table)
- IELTS Academic Writing Task 1: Main Reasons why Agricultural Land Becomes Less Productive
- Cinema Viewing Figures for Films by Country, in Millions- Table
- Number of Medals Won by the Top Ten Countries in the London 2012 Olympic Games- Table
- IELTS Academic Writing Task 1 Topic 12: Internet use in six categories by age group – Table
- IELTS Academic Writing Task 1 Topic : Annual pay for doctors and other workers – Bar chart
- Division of Household Tasks by Gender in Great Britain- Bar Graph
- IELTS Academic Writing Task 1 Topic 11: Different methods of waste disposal in four cities – Bar Chart
- Amount of Leisure Time Enjoyed by Men and Women of Different Employment Statuses- Bar Chart
- Number of Computer and Internet users in Different Arab Countries- Bar Graph
- The Changes In Ownership Of Electrical Appliances And Amount Of Time Spent Doing Housework In Households – IELTS Writing Task 1
- IELTS Academic Writing Task 1 Topic : The Percentage of Female Members of Parliament in 5 European Countries
- IELTS Writing Task 1 – The graph below shows different sources of air pollutants in the UK Sample Answers
- IELTS Academic Writing Task 1 Topic: Price changes for fresh fruits and vegetables – Line Graph
- Demand for Electricity in England- Line Graph and Pie Chart
- Average Household Expenditures in a Country in 1950 and 2010- Pie Chart
- Methods of Transportation for People Traveling to a University – Pie Chart
- Percentage of Water Used for Different Purposes in Six Areas of the World- Pie Chart
- Online shopping sales for retail sectors in Canada – IELTS Writing Task 1 Pie chart
- IELTS Academic Writing Task 1: Main Reasons why Agricultural Land Becomes Less Productive
- IELTS Academic Writing Task 1 Topic 09 : Consequence of deforestation – FlowChart
- IELTS Academic Writing Task 1 Topic 09 : Consequence of deforestation – FlowChart
- Academic IELTS Writing Task 1 Recycling process of wasted glass bottles Sample Answers
- Water Cycle Diagram – IELTS Academic Writing Task 1 Answers
- IELTS Writing Task 1 Process Chart 2024 – Process Diagram with Sample Answers
- Demand for Electricity in England- Line Graph and Pie Chart
- Percentage of Food Budget the Average Family Spent on Restaurant Meals- Pie Chart + Line Graph
- Amount of Money Per Week Spent on Fast Food in Britain- Bar Graph + Line Graph
- Water use Worldwide and Water Consumption- Line Graph and Table
Learn IELTS Writing Task 1 with IELTSMaterial
If you’re looking to enhance your writing skills for the IELTS exam, IELTSMaterial can be a valuable resource. Feel free to check out our highly rated IELTS Vocabulary ebook and IELTS Writing learning material with example answers, or get in touch with our IELTS experts if you need more advice. Take the step you need to boost your prep further and receive a Band 8+ on the IELTS Writing Task 1!
Frequently Asked Questions
What is the format of IELTS Writing Task 1?
How much time should I spend on IELTS Writing Task 1?
Do I need to include my opinion in IELTS Writing Task 1?
Should I include an introduction and conclusion in IELTS Writing Task 1?
How can I improve my vocabulary for describing visual data in Task 1?
Where can I find practice materials for Task 1?
What should I do if I don't understand the visual data in Task 1?
Should I include every detail from the visual data in my response?
Is there a specific paragraph structure I should follow in Task 1?
How can I practice for IELTS Writing Task 1?
Practice IELTS Writing Task 1 based on report types
Recent Articles

Kasturika Samanta

Nehasri Ravishenbagam

Prity Mallick

Kasturika Samanta

